Smart Charging Australia
Consumer Preferences towards Electric Vehicle Smart Charging Program Attributes: A Stated Preference Study
1. Summary
Philip and Whitehead (2024) conducted a study regarding EV smart charging in Australia. They utilized discrete choice modeling (DCM) by creating logit models, and created conjoint surveys using the conjointly software. The survey was conducted in December 2021 on the survey panel Dynata. They collected 1,176 complete responses of current car owners throughout Australia who may become future EV owners. This study included both managed charging and V2G, and worked out willingness to pay (WTP) of the mixed logit model (MXL).
The survey results indicated that:
- Consumer willingness to participate decreases with increase in smart charging electricity price and with increase in peak hour manual charging electricity price.
- Consumer willingness to participate increases with higher daily guaranteed driving range and with financial incentive in the form of annual electricity bill credit.
- No significant effect was found for override allowance.
This study concluded these policy implications to increase consumer participation:
- Low smart charging prices, low penalties for peak hour manual charging, high minimum driving range, high incentives, more younger users, and finally, tailoring programs with respect to demographics.
2. Methodology
Similar to ours, Dr Whitehead’s study also used DCM and logit model. Below are the differences:
- It used MXL only, while we use MNL, MXL, MNL with subgroups, and Latent Class Model (LCM).
- It used 1000 Halton draws. We have \(10^5\).
- It utilized WTP for peak time manual charging (aka charging penalty), electricity bill credit (aka recurring cash back), and guaranteed minimum range (aka guaranteed battery threshold). We can consider how we would like to model our WTP.
3. The Survey
This study has 2 sections: demographic and smart charging.
- The demographic section contains only non-conjoint questions. It collects demographics information and EV using experiences. By the end of this part, there are educational questions and tutorial about EV and smart charging, including texts, images, and a YouTube video.
- The smart charging section introduces the smart charging program, followed by single-choice questions about charging behaviors. The conjoint part starts with an example with explanation, followed by 8 conjoint questions.
The conjoint questions have these attributes:
- Annual electricity bill credit - This is the same as our monthly cash incentives.
- Guaranteed daily driving range - This is a combination of our minimum and guaranteed threshold. However, they simplified the charging process and skipped over the case-by-case range calculation, which is reasonable, since most of the participants are not EV owners. It’s not necessary to ask for their EV range and calculate specific ranges based on their own cars.
- Monthly override - Ranging from 1 to 5, similar to ours.
- Smart charging price - This is the most interesting one. In their definition, this smart charging price is the electricity price for smart charging. It replaces the general electricity price provided by the utilities.
- Manually charging penalty during peak hours - It means if users fast charge their cars during peak hours, the electricity price will be more expensive. This is what we never thought of. However, we tend to avoid “penalties”.
One interesting point is that each conjoint question has its selected option repeated, asking “If you owned an EV, would you actually participate in this smart charging program”. Below is a conjoint question example:
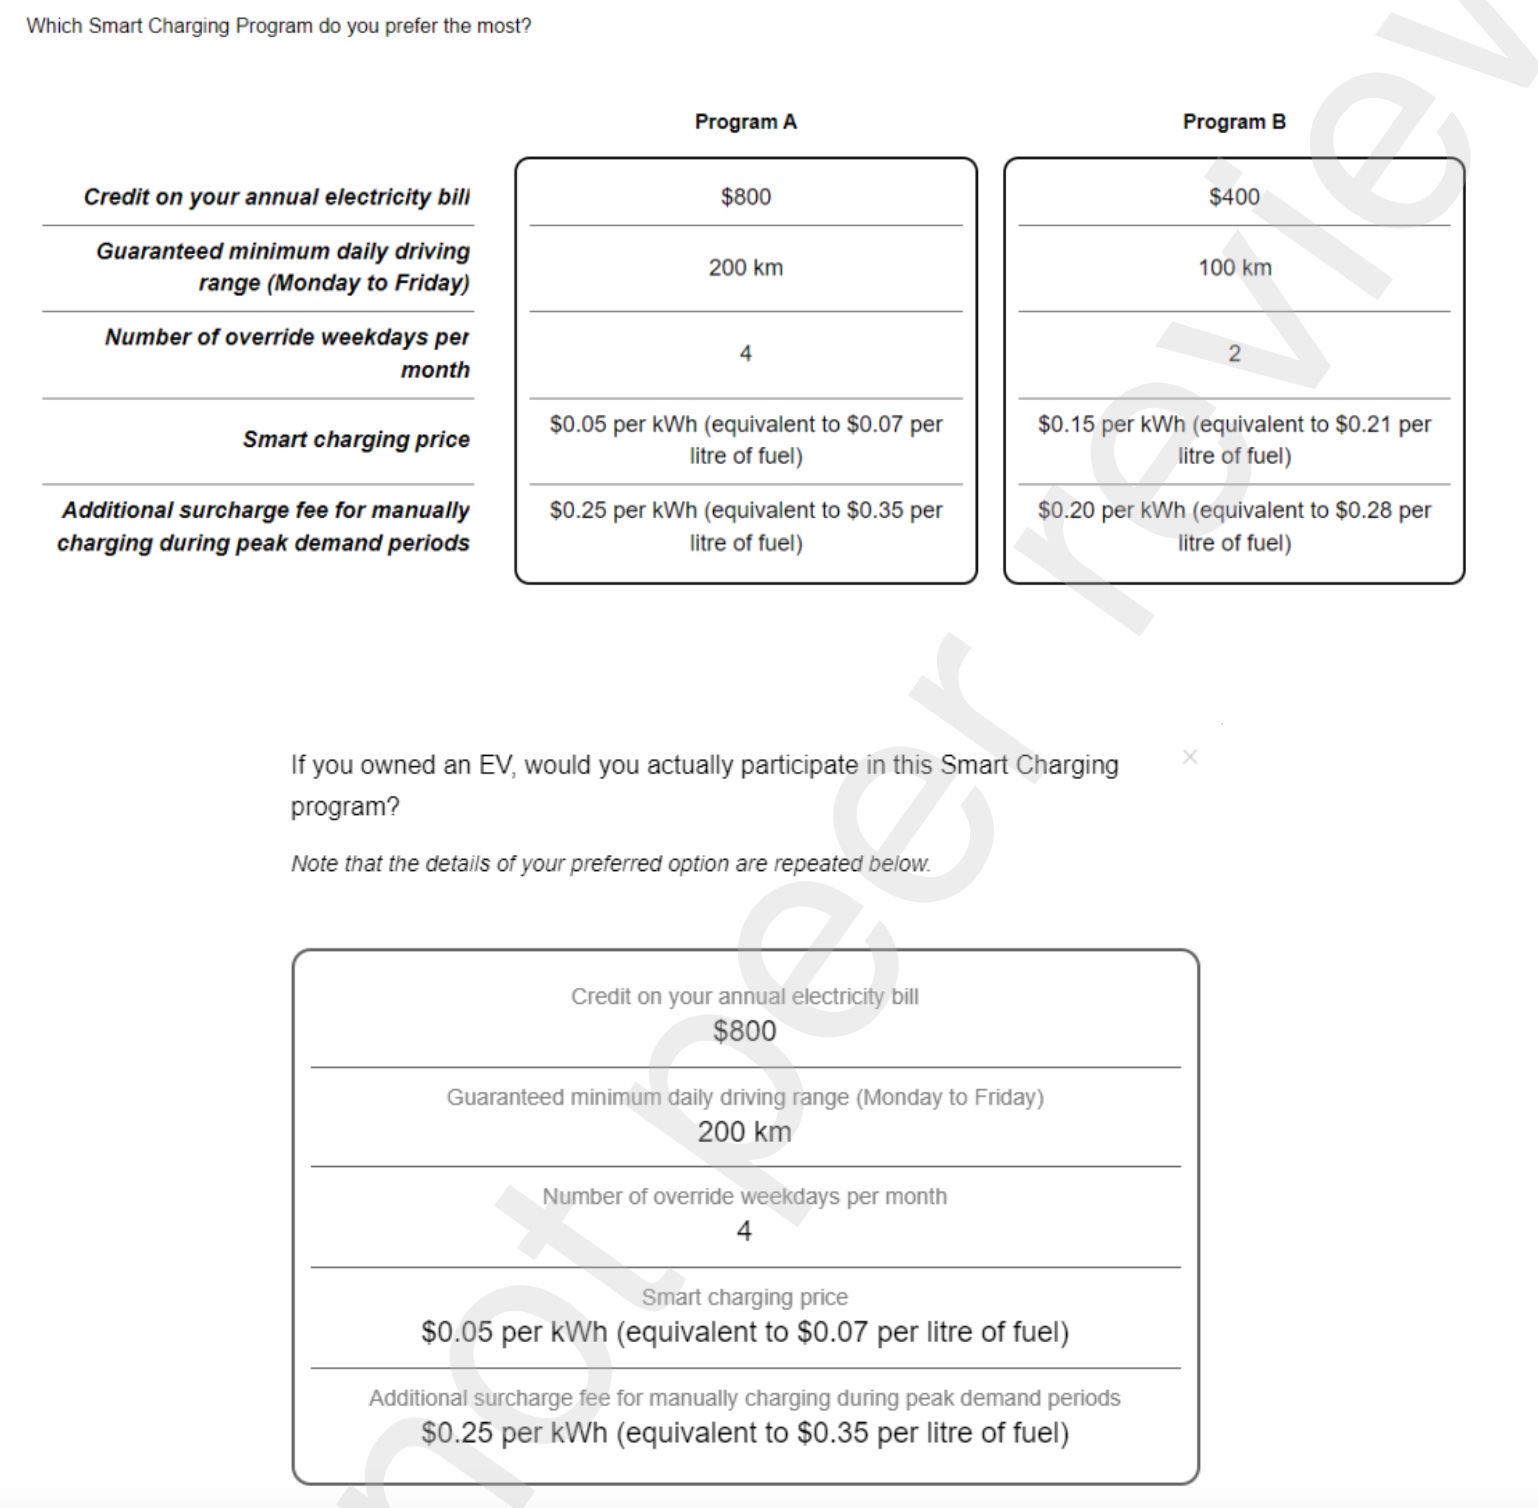
Instead of using the “Not Interested” option, this study forces the users to pick from the 2 options, and then ask for users acceptance.
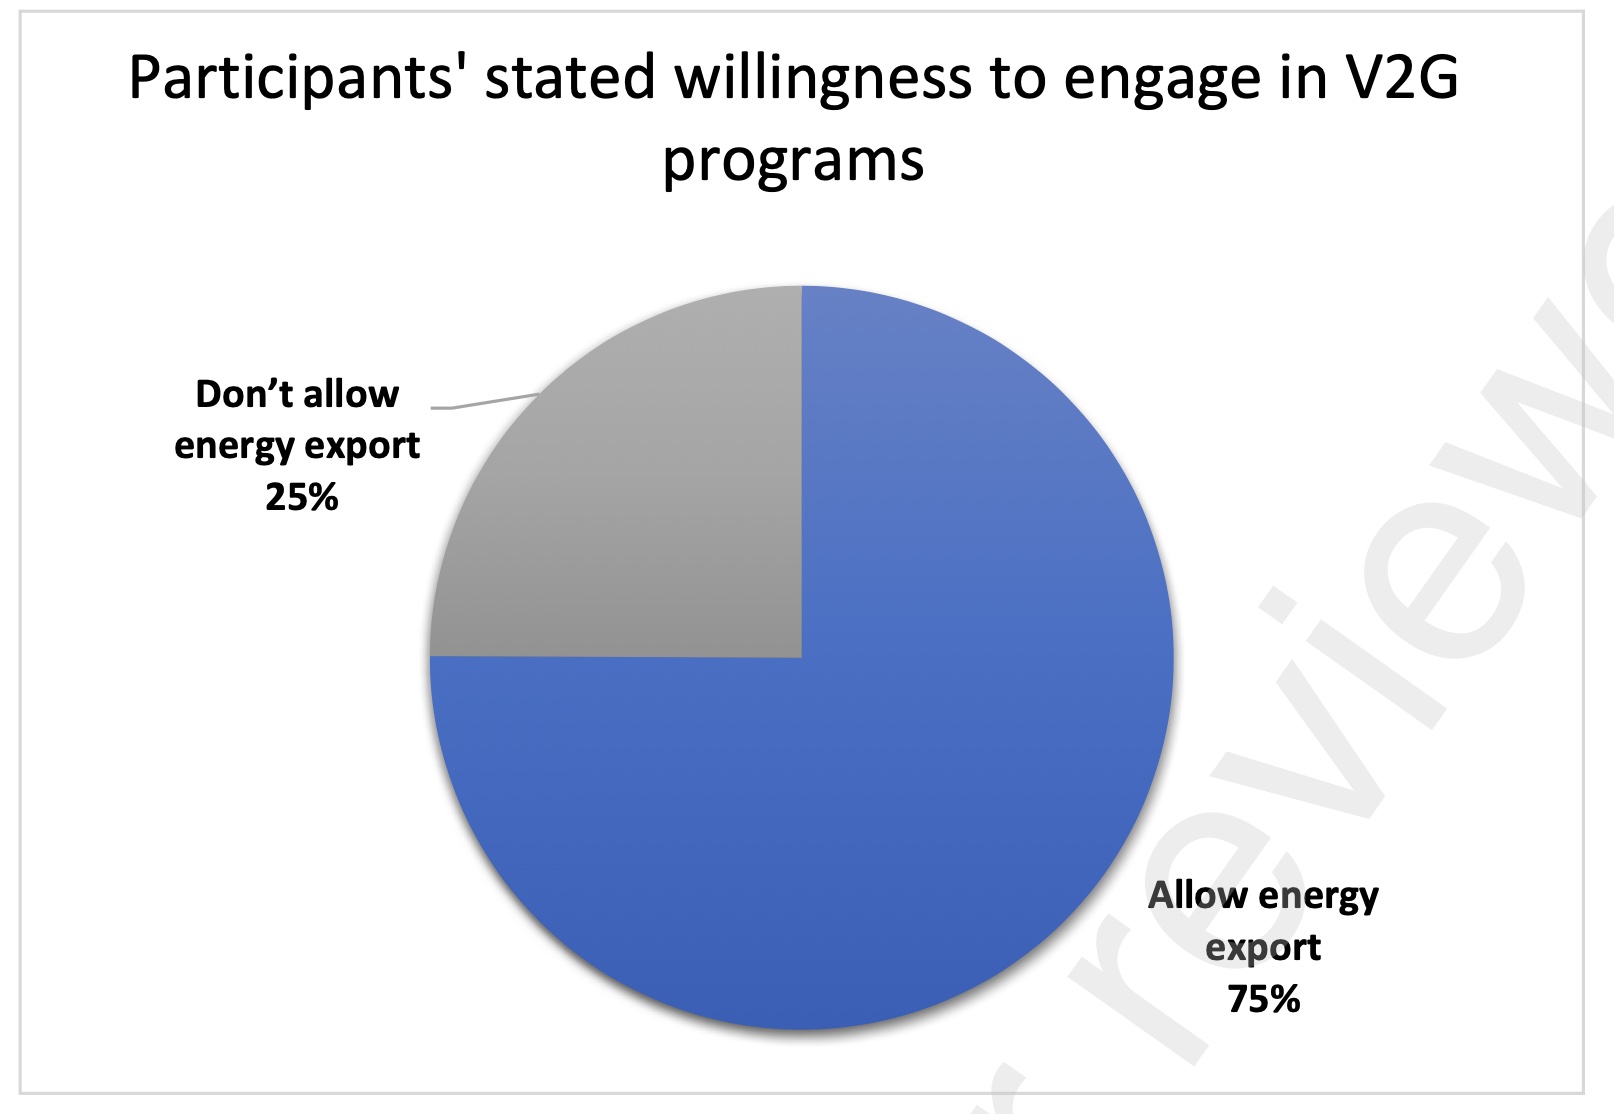
4. V2G
This study also asks for V2G, but instead of a standalone set of conjoint questions, it merely asks for V2G familiarity and V2G acceptance. Below is the result:
5. Willingness To Pay (WTP)
The WTP values are calculated for 3 variables:
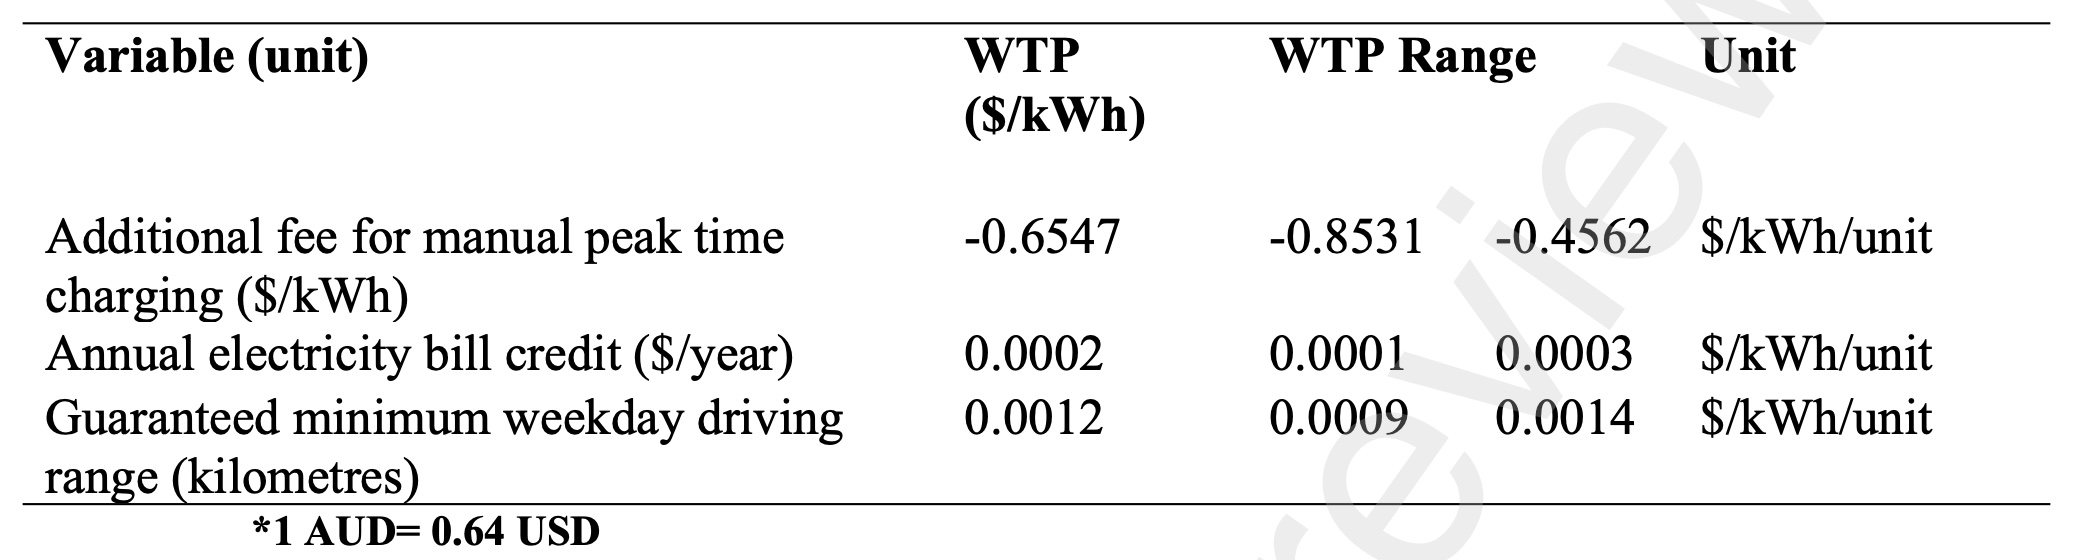
The WTP values are easily calculated since these 3 values are all in monetary units. This is a very good example for our WTP model development.
6. Gaps and Limitations
- Dynata has plenty of click workers. Their response reliability could be questionable. For example, female takes 52.9%. This percentage is more than expected.
- The survey fielding in only in December 2021, which means 1 month to the most. This time duration is short.
- The EV ownership is only 1.28%, and EV driving experience rate is only 9.24%. It means the majority of the participants are non-EV owners/drivers.
- This study did not converge into a quantitative smart charging program design.
- The policy implications mentioned heterogeneity, but did not quantify it with subgroups. This can be accomplished by grouped MNL models.