| Catetory | Hardman's (%) | Ours (%) | Difference (%) |
|---|---|---|---|
| Income - < $100,000 | 15.04 | 24.03 | 8.99 |
| Income - $100,000 to $200,000 | 52.76 | 45.61 | 7.15 |
| Income - > $200,000 | 32.19 | 30.36 | 1.83 |
| Single Family Home | 78.45 | 84.41 | 5.96 |
| Home Ownership | 82.08 | 91.41 | 9.33 |
| Gender Male | 77.73 | 85.31 | 7.58 |
| Household Vehicles - 0 | 0.00 | 0.00 | 0.00 |
| Household Vehicles - 1 | 18.20 | 22.37 | 4.17 |
| Household Vehicles - 2 | 51.40 | 58.98 | 7.58 |
| Household Vehicles - >2 | 30.40 | 18.53 | 11.87 |
| Age Group - <40 | 32.28 | 11.64 | 20.64 |
| Age Group - 40 to 59 | 42.01 | 39.95 | 2.06 |
| Age Group - >59 | 25.33 | 48.40 | 23.07 |
Federal Tax on PEV
Exploring the Impact of the Federal Tax Credit on the Decision to Lease or Purchase a PEV in California
1. Summary
Hoogland et al. (2023) have conducted a study to sample 7,000 PEV lessees and purchasers in California. The study resulted in 2 MNL models with stated preference toward the absence of the federal tax credit. It was found that, for lessees, without discounts of the tax credit, they would not lease at all, and for purchasers, they might not purchase, or change to a CV or another PEV. This difference is more severe for lessees than purchasers. It was also found that renters are more likely than homeowners to lease a CV in the absence of tax credit.
2. Methods
7,000 survey responses are collected in California in 2019. They are sampled from California Clean Vehicle Rebate Project (CVRP) recipients.
The survey asks the users’ decisions on the absence of the federal tax credit. Possible responses include:
- Purchase/lease the same PEV
- Switch to a different PEV
- Switch to a conventional or hybrid (non-plug in) vehicle, or not acquire a vehicle at all
The study did not indicate what platform the survey was taken, nor did it specify the software it utilized to generate the 2 MNL models.
3. Results
Three tables were generated from the study:
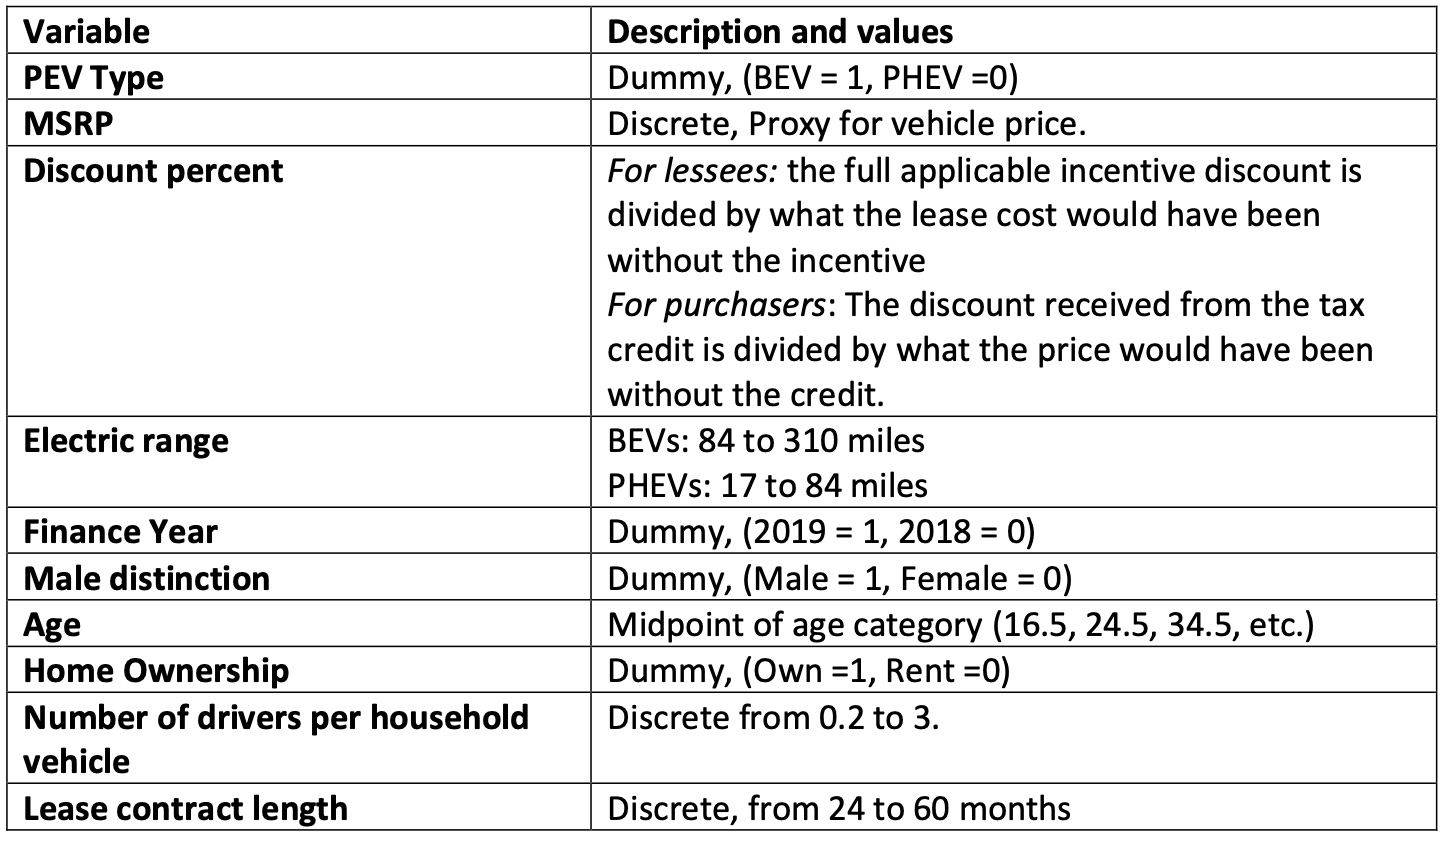
- Variables used in the MNL models
- Statistics with comparison to Californian community survey
- Average vehicle characteristics by finance method (purchase vs lease)
3.1 Table 1: Variables used in the MNL models
3.2 Table 2: Statistics with comparison to Californian community survey
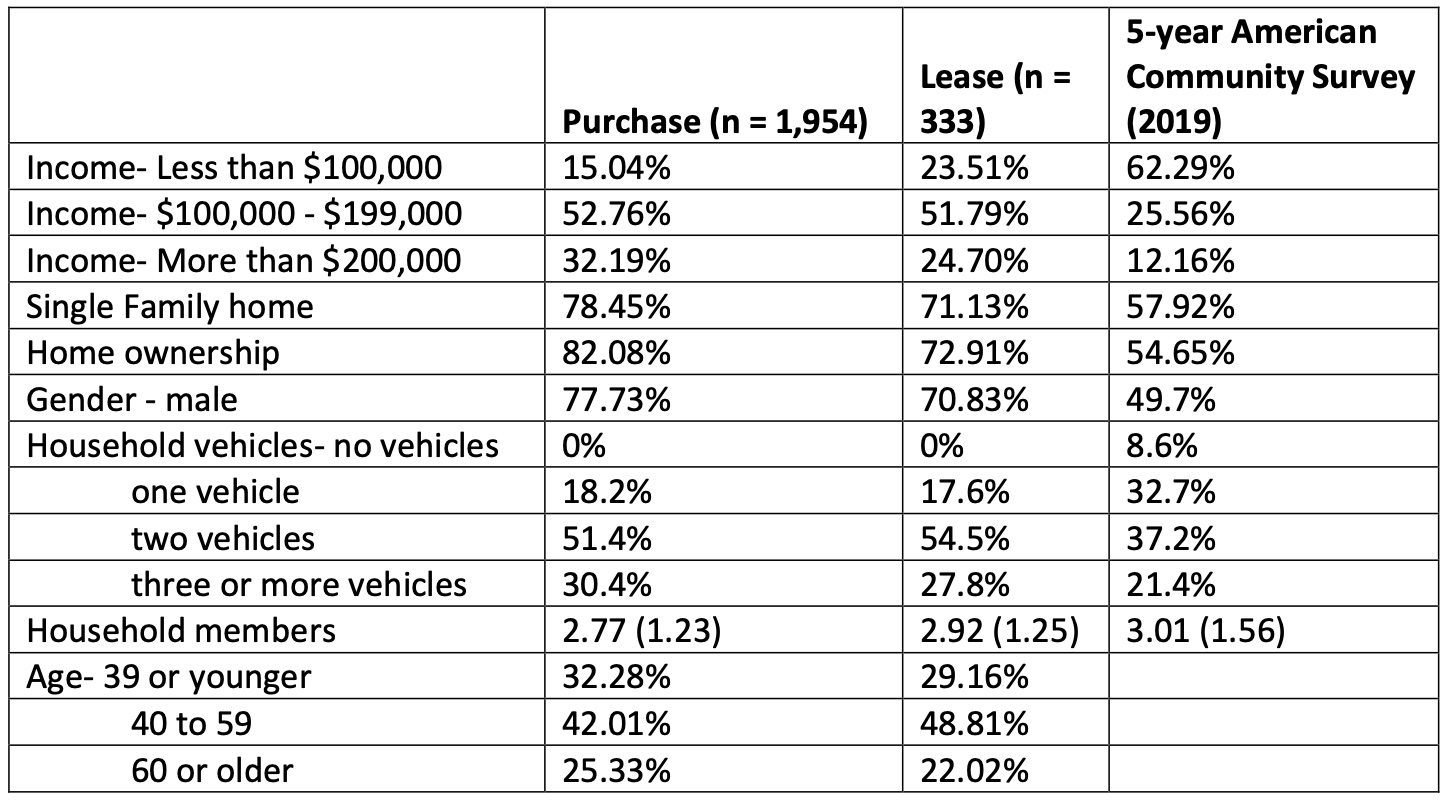
This shows the comparison of PEV purchase, lease, and census in general. Note that all 3 sets of data are limited to Californian PEV users/residents only, and the data were collected in 2019. This data set can be both a subgrouping guide, as well as a demographic distribution reference for us.
A simple comparison between the above Purchase column and our results in the form of Hardman’s vs Ours:
Our data cut-off is May 14.
The biggest difference is in the age groups: Even though the EV owners tend to be older people instead of young people, we still have visibly more people over 60.
3.3 Table 3: Average vehicle characteristics by finance method
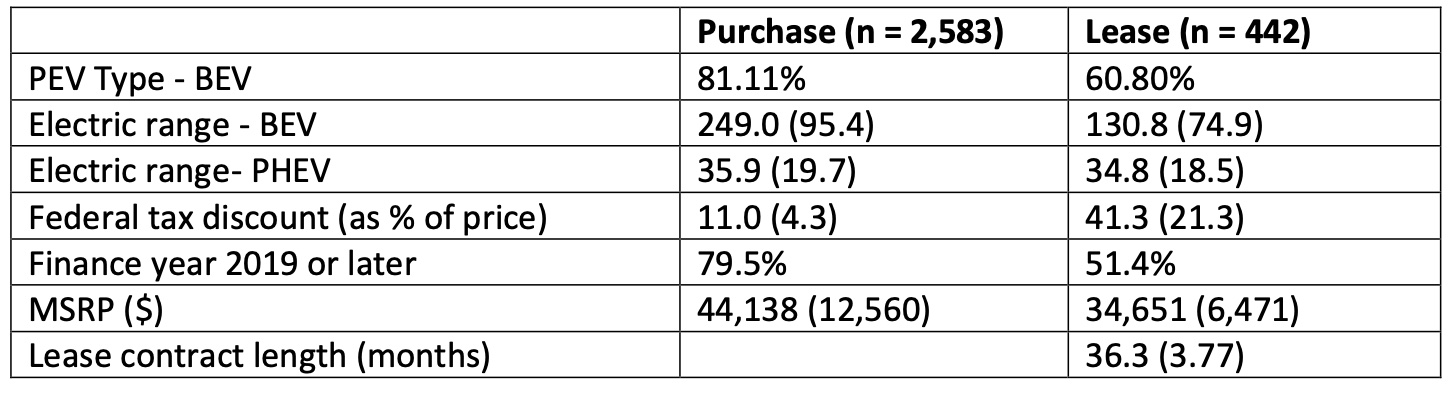
In Hardman’s study, 81.11% of PEV owners own BEVs.
References
Hoogland, Kelly, Scott Hardman, Debapriya Chakraborty, and David Bunch. 2023. “Exploring the Impact of the Federal Tax Credit on the Decision to Lease or Purchase a PEV in California,” May. https://doi.org/10.7922/G25Q4TFC.